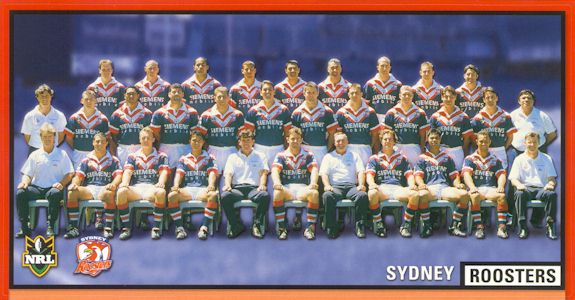
BACK ROW: Luke Phillips,
Brendan Hurst, David Solomona, Shannon Hegarty, Richie Barnett, Quentin Pongia, Darren
Burns, Shane Rigon, Nathan Wood
SECOND ROW: Craig Walker (Medical Co-ordinator), Robert Miles, Andrew
Lomu, Ian Rubin, Bryan Fletcher, Dallas Hood, Peter Cusack, Scott Logan, Craig Fitzgibbon,
Luke Ricketson, Julian Bailey, Arthur Beetson (Recruitment Officer)
FRONT ROW: Ronnie Palmer (Strength & Conditioning Co-ordinator),
Simon Bonetti, Ryan Cross, Craig Wing, Grant Jones (Football Co-ordinator), Brad Fittler
(Captain), Graham Murray (First Grade Coach), Jack Elsegood, Matt Sing, Adriam Lam, Brian
Canavan (Football Manager)
| 2000 Season | ||||||
| Opponent | Venue | Result | Score | Crowd | Referee | |
| 1 | Parramatta Eels | Stadium Australia | Won | 20-16 | 62,255 | Bill Harrigan |
| 2 | Sharks | Toyota Park | Lost | 2-28 | 13,112 | Sean Hampstead |
| 3 | North Queensland Cowboys | Sydney Football Stadium | Won | 32-12 | 5,820 | Steve Clark |
| 4 | Bulldogs | Sydney Football Stadium | Lost | 12-32 | 14,326 | Bill Harrigan |
| 5 | Northern Eagles | Sydney Football Stadium | Won | 22-2 | 8,373 | Paul Simpkins |
| 6 | Melbourne Storm | Olympic Park | Lost | 10-42 | 14,032 | Tim Mander |
| 7 | Wests Tigers | Sydney Football Stadium | Won | 35-6 | 13,519 | Steve Clark |
| 8 | Auckland Warriors | Ericsson Stadium | Lost | 22-26 | 11,125 | Tony Archer |
| 9 | Newcastle Knights | Sydney Football Stadium | Won | 20-18 | 13,055 | Tim Mander |
| 10 | St George-Illawarra Dragons | WIN Stadium | Lost | 20-24 | 13,221 | Steve Clark |
| 11 | Penrith Panthers | Penrith Football Stadium | Won | 30-22 | 10,579 | Paul Simpkins |
| 12 | Canberra Raiders | Sydney Football Stadium | Won | 21-14 | 11,664 | Bill Harrigan |
| 13 | Sharks | Sydney Football Stadium | Won | 16-14 | 12,236 | Steve Clark |
| 14 | Wests Tigers | Campbelltown Stadium | Lost | 24-28 | 12,255 | Moghseen Jadwat |
| 15 | Brisbane Broncos | ANZ Stadium | Lost | 14-40 | 15,557 | Tim Mander |
| 16 | St George-Illawarra Dragons | Sydney Football Stadium | Won | 32-24 | 13,285 | Sean Hampstead |
| 17 | Bulldogs | Stadium Australia | Lost | 22-16 | 11,247 | Sean Hampstead |
| 18 | Northern Eagles | NorthPower Stadium | Won | 22-20 | 14,353 | Tony Archer |
| 19 | Melbourne Storm | Sydney Football Stadium | Won | 41-6 | 10,772 | Steve Clark |
| 20 | Parramatta Eels | Parramatta Stadium | Won | 26-0 | 16,215 | Bill Harrigan |
| 21 | Auckland Warriors | Sydney Football Stadium | Won | 36-4 | 7,286 | Mark Oaten |
| 22 | Newcastle Knights | Marathon Stadium | Lost | 12-46 | 15,394 | Paul Simpkins |
| 23 | Canberra Raiders | Bruce Stadium | Lost | 12-40 | 23,603 | Paul Simpkins |
| 24 | Penrith Panthers | Sydney Football Stadium | Won | 40-14 | 13,169 | Tim Mander |
| 25 | North Queensland Cowboys | Dairy Farmers Stadium | Won | 36-20 | 14,894 | Mark Oaten |
| 26 | Brisbane Broncos | Sydney Football Stadium | Won | 28-0 | 22,613 | Mark Oaten |
| 3rd Qualifying Final | Parramatta Eels | Sydney Football Stadium | Lost | 8-32 | 21,377 | Bill Harrigan |
| 2nd Semi Final | Canberra Raiders | Sydney Football Stadium | Won | 38-10 | 16,441 | Tim Mander |
| 1st Preliminary Final | Newcastle Knights | Sydney Football Stadium | Won | 26-20 | 33,727 | Bill Harrigan |
| GRAND FINAL | Brisbane Broncos | Stadium Australia | Lost | 6-14 | 92,277 | Bill Harrigan |
| Average home crowd: | 13,634 | |||||
| Adjusted for Double Header: | 12,177 | |||||
| Aggregate crowd: | 362,832 | |||||
| 2000 Pointscorers | ||||||||||||
| Average | ||||||||||||
| Field | Average | Average | Metres | Effective | Line | |||||||
| Player | App. | Int. | Tries | Goals | Goals | Points | Hit Ups | Tackles | Gained | Tackles | Breaks | Offloads |
| Craig Fitzgibbon | 29 | 0 | 5 | 77 | 0 | 174 | 11.76 | 23.72 | 91 | 92.47% | 5 | 32 |
| Simon Bonetti | 28 | 2 | 1 | 0 | 0 | 4 | 4.87 | 29.30 | 39 | 95.13% | 3 | 3 |
| Luke Ricketson | 27 | 1 | 3 | 0 | 0 | 12 | 11.71 | 28.43 | 88 | 94.65% | 4 | 23 |
| Ian Rubin | 26 | 2 | 2 | 0 | 0 | 8 | 11.18 | 24.18 | 97 | 96.30% | 3 | 13 |
| Brad Fittler | 26 | 1 | 9 | 0 | 0 | 36 | 9.19 | 15.85 | 72 | 92.04% | 14 | 54 |
| Ryan Cross | 26 | 1 | 18 | 4 | 0 | 80 | 8.96 | 10.70 | 79 | 81.18% | 20 | 23 |
| Shannon Hegarty | 24 | 1 | 18 | 0 | 0 | 72 | 12.00 | 9.68 | 105 | 85.51% | 16 | 15 |
| Adrian Lam | 24 | 1 | 5 | 0 | 1 | 21 | 6.20 | 11.80 | 44 | 90.77% | 13 | 24 |
| Luke Phillips | 23 | 3 | 9 | 23 | 2 | 84 | 10.15 | 5.69 | 88 | 81.32% | 12 | 14 |
| Andrew Minichello | 23 | 1 | 7 | 0 | 0 | 28 | 10.75 | 6.63 | 86 | 79.90% | 11 | 4 |
| Bryan Fletcher | 22 | 3 | 3 | 0 | 0 | 12 | 15.68 | 22.92 | 125 | 93.78% | 9 | 72 |
| Matt Sing | 19 | 0 | 13 | 0 | 0 | 52 | 10.68 | 7.37 | 90 | 86.96% | 13 | 19 |
| Scott Logan | 16 | 4 | 1 | 0 | 0 | 4 | 11.95 | 17.45 | 100 | 90.89% | 1 | 27 |
| Robert Miles | 14 | 2 | 3 | 0 | 0 | 12 | 8.94 | 4.88 | 71 | 86.67% | 5 | 11 |
| Peter Cusack | 13 | 3 | 0 | 0 | 0 | 0 | 9.38 | 18.50 | 74 | 92.21% | 0 | 4 |
| Craig Wing | 11 | 16 | 8 | 0 | 0 | 32 | 10.41 | 11.04 | 84 | 87.39% | 15 | 29 |
| Darren Burns | 7 | 13 | 4 | 0 | 0 | 16 | 10.00 | 20.30 | 80 | 95.75% | 5 | 15 |
| Richie Barnett | 7 | 1 | 0 | 0 | 0 | 0 | 11.63 | 6.63 | 96 | 76.81% | 4 | 11 |
| Jack Elsegood | 7 | 0 | 1 | 0 | 0 | 4 | 8.57 | 3.43 | 66 | 72.73% | 1 | 1 |
| Shane Rigon | 4 | 7 | 1 | 0 | 0 | 4 | 7.36 | 1.09 | 55 | 86.52% | 1 | 8 |
| Julian Bailey | 3 | 7 | 1 | 0 | 0 | 4 | 10.40 | 14.00 | 74 | 83.83% | 3 | 10 |
| Nathan Wood | 3 | 4 | 0 | 0 | 0 | 0 | 3.57 | 15.57 | 24 | 90.08% | 2 | 5 |
| Dallas Hood | 2 | 21 | 1 | 0 | 0 | 4 | 9.83 | 15.30 | 81 | 93.87% | 2 | 37 |
| Quentin Pongia | 2 | 1 | 0 | 0 | 0 | 0 | 13.00 | 16.00 | 113 | 92.31% | 0 | 0 |
| Dean Widders | 2 | 1 | 0 | 0 | 0 | 0 | 7.67 | 19.67 | 67 | 84.29% | 0 | 1 |
| Nelson Lomi | 1 | 3 | 0 | 0 | 0 | 0 | 7.75 | 22.00 | 62 | 93.62% | 0 | 2 |
| Chris Flannery | 1 | 1 | 1 | 0 | 0 | 4 | 8.50 | 9.00 | 51 | 81.82% | 0 | 0 |
| David Solomona | 0 | 19 | 3 | 0 | 0 | 12 | 9.21 | 12.47 | 70 | 88.43% | 7 | 42 |
| Albert Talipeau | 0 | 3 | 0 | 0 | 0 | 0 | 3.67 | 17.67 | 27 | 85.48% | 0 | 0 |
| Andrew Lomu | 0 | 3 | 0 | 0 | 0 | 0 | 8.00 | 9.67 | 64 | 90.63% | 0 | 5 |
| Brendan Hurst | 0 | 2 | 0 | 0 | 0 | 0 | 5.50 | 16.50 | 42 | 94.29% | 0 | 0 |