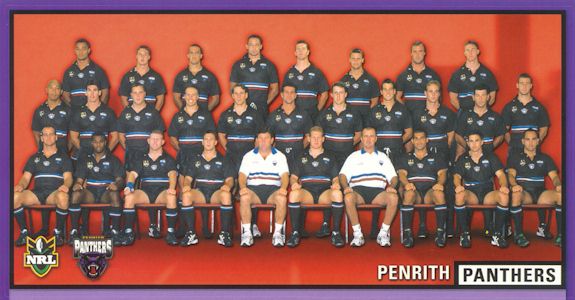
BACK ROW: Tony Puletua, Chris Hicks,
Carl Macnamara, Mark Geyer, Jody Gall, Duncan MacGillvray, Craig Greenhill, Andrew Hinson
SECOND ROW: Frank Puletua, Nigel Gaffey, David Elvy, Matthew Rodwell, Peter
Jorgensen, Scott Sattler, Lee Hopkins, Ryan Girdler, David Woods, Craig Gower, Shane
Elford
FRONT ROW: John Cross, Rhys Wesser, Brad Drew, Craig Levy, Royce Simmons (Coach),
Steve Carter (Captain), Alan Mair (Operations Manager), Sid Domic, Matthew Rieck, Robbie
Beckett
ABSENT: Matt Adamson
| 2000 Season | ||||||
| Opponent | Venue | Result | Score | Crowd | Referee | |
| 1 | North Queensland Cowboys | Penrith Football Stadium | Won | 19-2 | 10,623 | Mark Oaten |
| 2 | Bulldogs | Stadium Australia | Won | 26-0 | 11,214 | Paul Simpkins |
| 3 | Northern Eagles | Brookvale Oval | Lost | 16-27 | 14,718 | Moghseen Jadwat |
| 4 | Melbourne Storm | Penrith Football Stadium | Won | 30-22 | 11,132 | Sean Hampstead |
| 5 | Wests Tigers | Leichhardt Oval | Lost | 10-22 | 8,853 | Mark Oaten |
| 6 | Auckland Warriors | Penrith Football Stadium | Won | 31-24 | 9,305 | Moghseen Jadwat |
| 7 | Newcastle Knights | Penrith Football Stadium | Lost | 10-30 | 12,514 | Bill Harrigan |
| 8 | Canberra Raiders | Bruce Stadium | Lost | 6-30 | 11,044 | Paul Simpkins |
| 9 | Brisbane Broncos | Penrith Football Stadium | Won | 18-2 | 15,290 | Mark Oaten |
| 10 | Parramatta Eels | Parramatta Stadium | Lost | 12-14 | 16,172 | Moghseen Jadwat |
| 11 | Sydney Roosters | Penrith Football Stadium | Lost | 22-30 | 10,579 | Paul Simpkins |
| 12 | St George-Illawarra Dragons | Sydney Football Stadium | Lost | 20-28 | 8,849 | Sean Hampstead |
| 13 | Bulldogs | Penrith Football Stadium | Lost | 12-16 | 11,684 | Tim Mander |
| 14 | Newcastle Knights | Marathon Stadium | Won | 32-26 | 16,447 | Mark Oaten |
| 15 | Sharks | Toyota Park | Won | 28-26 | 8,736 | Sean Hampstead |
| 16 | Parramatta Eels | Penrith Football Stadium | Won | 16-14 | 18,371 | Steve Clark |
| 17 | Melbourne Storm | Olympic Park | Won | 23-20 | 11,156 | Bill Harrigan |
| 18 | Wests Tigers | Penrith Football Stadium | Won | 32-31 | 16,498 | Steve Clark |
| 19 | Auckland Warriors | Ericsson Stadium | Won | 24-20 | 10,305 | Sean Hampstead |
| 20 | North Queensland Cowboys | Dairy Farmers Stadium | Lost | 12-28 | 10,851 | Sean Hampstead |
| 21 | Canberra Raiders | Penrith Football Stadium | Won | 36-14 | 15,240 | Paul Simpkins |
| 22 | Brisbane Broncos | ANZ Stadium | Lost | 6-48 | 24,912 | Tim Mander |
| 23 | St George-Illawarra Dragons | Penrith Football Stadium | Won | 42-12 | 19,330 | Bill Harrigan |
| 24 | Sydney Roosters | Sydney Football Stadium | Lost | 14-40 | 13,169 | Tim Mander |
| 25 | Northern Eagles | Penrith Football Stadium | Won | 32-26 | 15,255 | Moghseen Jadwat |
| 26 | Sharks | Penrith Football Stadium | Won | 44-6 | 20,510 | Bill Harrigan |
| 1st Qualifying Final | Canberra Raiders | Bruce Stadium | Lost | 16-34 | 18,479 | Steve Clark |
| 1st Semi Final | Parramatta Eels | Sydney Football Stadium | Lost | 10-28 | 25,746 | Bill Harrigan |
| Average home crowd: | 14,367 | |||||
| Aggregate crowd: | 352,757 | |||||
| 2000 Pointscorers | ||||||||||||
| Average | ||||||||||||
| Field | Average | Average | Metres | Effective | Line | |||||||
| Player | App. | Int. | Tries | Goals | Goals | Points | Hit Ups | Tackles | Gained | Tackles | Breaks | Offloads |
| Robbie Beckett | 27 | 0 | 8 | 0 | 0 | 32 | 10.52 | 3.78 | 81 | 78.46% | 11 | 13 |
| Carl MacNamara | 26 | 2 | 0 | 0 | 0 | 0 | 14.46 | 20.25 | 120 | 93.26% | 0 | 24 |
| John Cross | 26 | 0 | 5 | 0 | 0 | 20 | 9.92 | 29.69 | 71 | 94.15% | 8 | 32 |
| Matthew Rodwell | 26 | 0 | 7 | 0 | 1 | 29 | 3.92 | 10.38 | 26 | 85.44% | 8 | 11 |
| Chris Hicks | 25 | 0 | 10 | 16 | 0 | 72 | 10.28 | 4.24 | 83 | 85.48% | 7 | 5 |
| Ryan Girdler | 24 | 0 | 13 | 78 | 2 | 210 | 10.17 | 12.13 | 98 | 85.09% | 19 | 32 |
| Steve Carter | 23 | 0 | 9 | 0 | 0 | 36 | 5.83 | 13.00 | 44 | 75.31% | 10 | 13 |
| Tony Puletua | 22 | 3 | 7 | 0 | 0 | 28 | 9.92 | 18.72 | 87 | 91.41% | 10 | 17 |
| Shane Elford | 21 | 3 | 10 | 0 | 0 | 40 | 9.71 | 10.67 | 74 | 88.89% | 13 | 18 |
| Peter Jorgensen | 21 | 2 | 10 | 0 | 0 | 40 | 10.65 | 4.74 | 84 | 70.78% | 11 | 7 |
| Craig Gower | 21 | 0 | 6 | 0 | 0 | 24 | 8.90 | 22.14 | 68 | 90.29% | 9 | 24 |
| Craig Greenhill | 21 | 0 | 0 | 0 | 0 | 0 | 14.67 | 18.81 | 120 | 91.01% | 2 | 6 |
| Matt Adamson | 17 | 2 | 2 | 0 | 0 | 8 | 13.84 | 18.63 | 111 | 92.67% | 3 | 16 |
| David Woods | 15 | 3 | 2 | 0 | 0 | 8 | 7.83 | 9.17 | 65 | 83.33% | 8 | 17 |
| Scott Sattler | 14 | 11 | 2 | 0 | 0 | 8 | 12.20 | 24.04 | 94 | 92.89% | 7 | 34 |
| Rhys Wesser | 6 | 1 | 1 | 0 | 0 | 4 | 15.57 | 2.43 | 141 | 70.83% | 2 | 1 |
| Lee Hopkins | 5 | 15 | 0 | 0 | 0 | 0 | 7.45 | 17.45 | 54 | 93.82% | 2 | 19 |
| Jody Gall | 5 | 14 | 0 | 0 | 0 | 0 | 12.58 | 15.84 | 105 | 93.48% | 2 | 28 |
| Brad Drew | 4 | 7 | 1 | 0 | 0 | 4 | 4.91 | 15.45 | 38 | 94.97% | 4 | 6 |
| Matthew Reick | 4 | 3 | 1 | 0 | 0 | 4 | 6.00 | 13.14 | 46 | 87.62% | 2 | 1 |
| Mark Geyer | 3 | 20 | 1 | 0 | 0 | 4 | 10.96 | 14.30 | 81 | 86.35% | 1 | 56 |
| Nigel Gaffey | 3 | 5 | 1 | 0 | 0 | 4 | 10.75 | 20.50 | 77 | 93.71% | 1 | 7 |
| Sid Domic | 2 | 11 | 4 | 0 | 0 | 16 | 8.77 | 15.46 | 74 | 94.81% | 6 | 7 |
| Fred Petersen | 2 | 1 | 1 | 0 | 0 | 4 | 12.00 | 4.00 | 101 | 80.00% | 1 | 0 |
| Ned Catic | 1 | 4 | 0 | 0 | 0 | 0 | 8.20 | 13.60 | 71 | 83.95% | 1 | 2 |
| Chris Levy | 0 | 6 | 1 | 0 | 0 | 4 | 5.17 | 15.50 | 30 | 92.08% | 2 | 0 |
| Frank Puletua | 0 | 6 | 0 | 0 | 0 | 0 | 10.33 | 16.83 | 79 | 90.99% | 0 | 5 |
| Duncan MacGillvray | 0 | 1 | 0 | 0 | 0 | 0 | 6.00 | 17.00 | 44 | 100.00% | 0 | 0 |